Overview
The Organization Usage Metrics page gives you comprehensive analytics and insights into how your team uses GC AI. You can access this page at https://app.gc.ai/metrics to track usage patterns, monitor team performance, and optimize your AI workflows.Accessing Metrics
From Organization Settings
To access metrics from your organization settings, follow these steps:- Navigate to Settings → Organization
- Select View Organization Usage Metrics in the Quick Actions section
- You’ll be redirected to the metrics page with your organization pre-selected
Direct Access
You can also access the metrics page directly:- Visit https://app.gc.ai/metrics
- Select your organization from the dropdown menu
Key Features
📊 Organization Selection
- Personal Usage: View your individual usage across all organizations (available to all users)
- Organization Usage: Analyze team-wide metrics for specific organizations (admin users only)
- Multi-org Support: Switch between different organizations where you have admin access
- Multiple Admins: Organizations can have multiple admin users who all have access to the same metrics dashboard
⏰ Time Period Options
You can choose from multiple predefined time ranges: Quick Selection:- Last 7 days
- Last 30 days
- Last 3 months
- Last 6 months
- Last 12 months
- All time
- This month
- Year to date
- Custom date range picker
- Start and end date selection
- Flexible period analysis
📈 Chart Types
Each metric panel supports multiple visualization options:- Bar Charts: Compare values across categories
- Stacked Bar Charts: Show composition and totals
- Line Charts: Track trends over time
- Pie Charts: Display proportions (member-based views)
- Tables: Detailed data breakdowns
Core Metrics
💬 Chat & Message Analytics
Total Usage
- Messages Sent: Total AI interactions across the organization
- Chats Created: Number of conversation threads started
- Per-Member Breakdown: Individual contribution analysis
Detailed Views
- By Member: See who’s using GC AI most actively
- By Interval: Daily, weekly, or monthly trends
- Time-based Analysis: Identify usage patterns and peak activity
🌐 Web Page Analysis
- Pages Scraped: Number of web pages processed
- Word Count: Total content analyzed
- Usage Patterns: Track research and information gathering
📁 File Management
- Files Uploaded: Document processing volume
- Content Types: Supported file formats
- Processing Statistics: Success rates and processing times
Word Add-in Metrics
📝 Microsoft Word Integration
Track usage of the GC AI Word add-in:- Word Messages: AI interactions within Word documents
- Word Chats: Document-specific conversations
- Redlines Applied: AI-suggested edits implemented
- Drafts Applied: AI-generated content incorporated
Add-in Analytics
- Per-Member Usage: Individual Word add-in activity
- Document Processing: Track editing and drafting workflows
- Productivity Metrics: Measure time saved through AI assistance
Weekly Insights Email
📧 Automated Weekly Reports
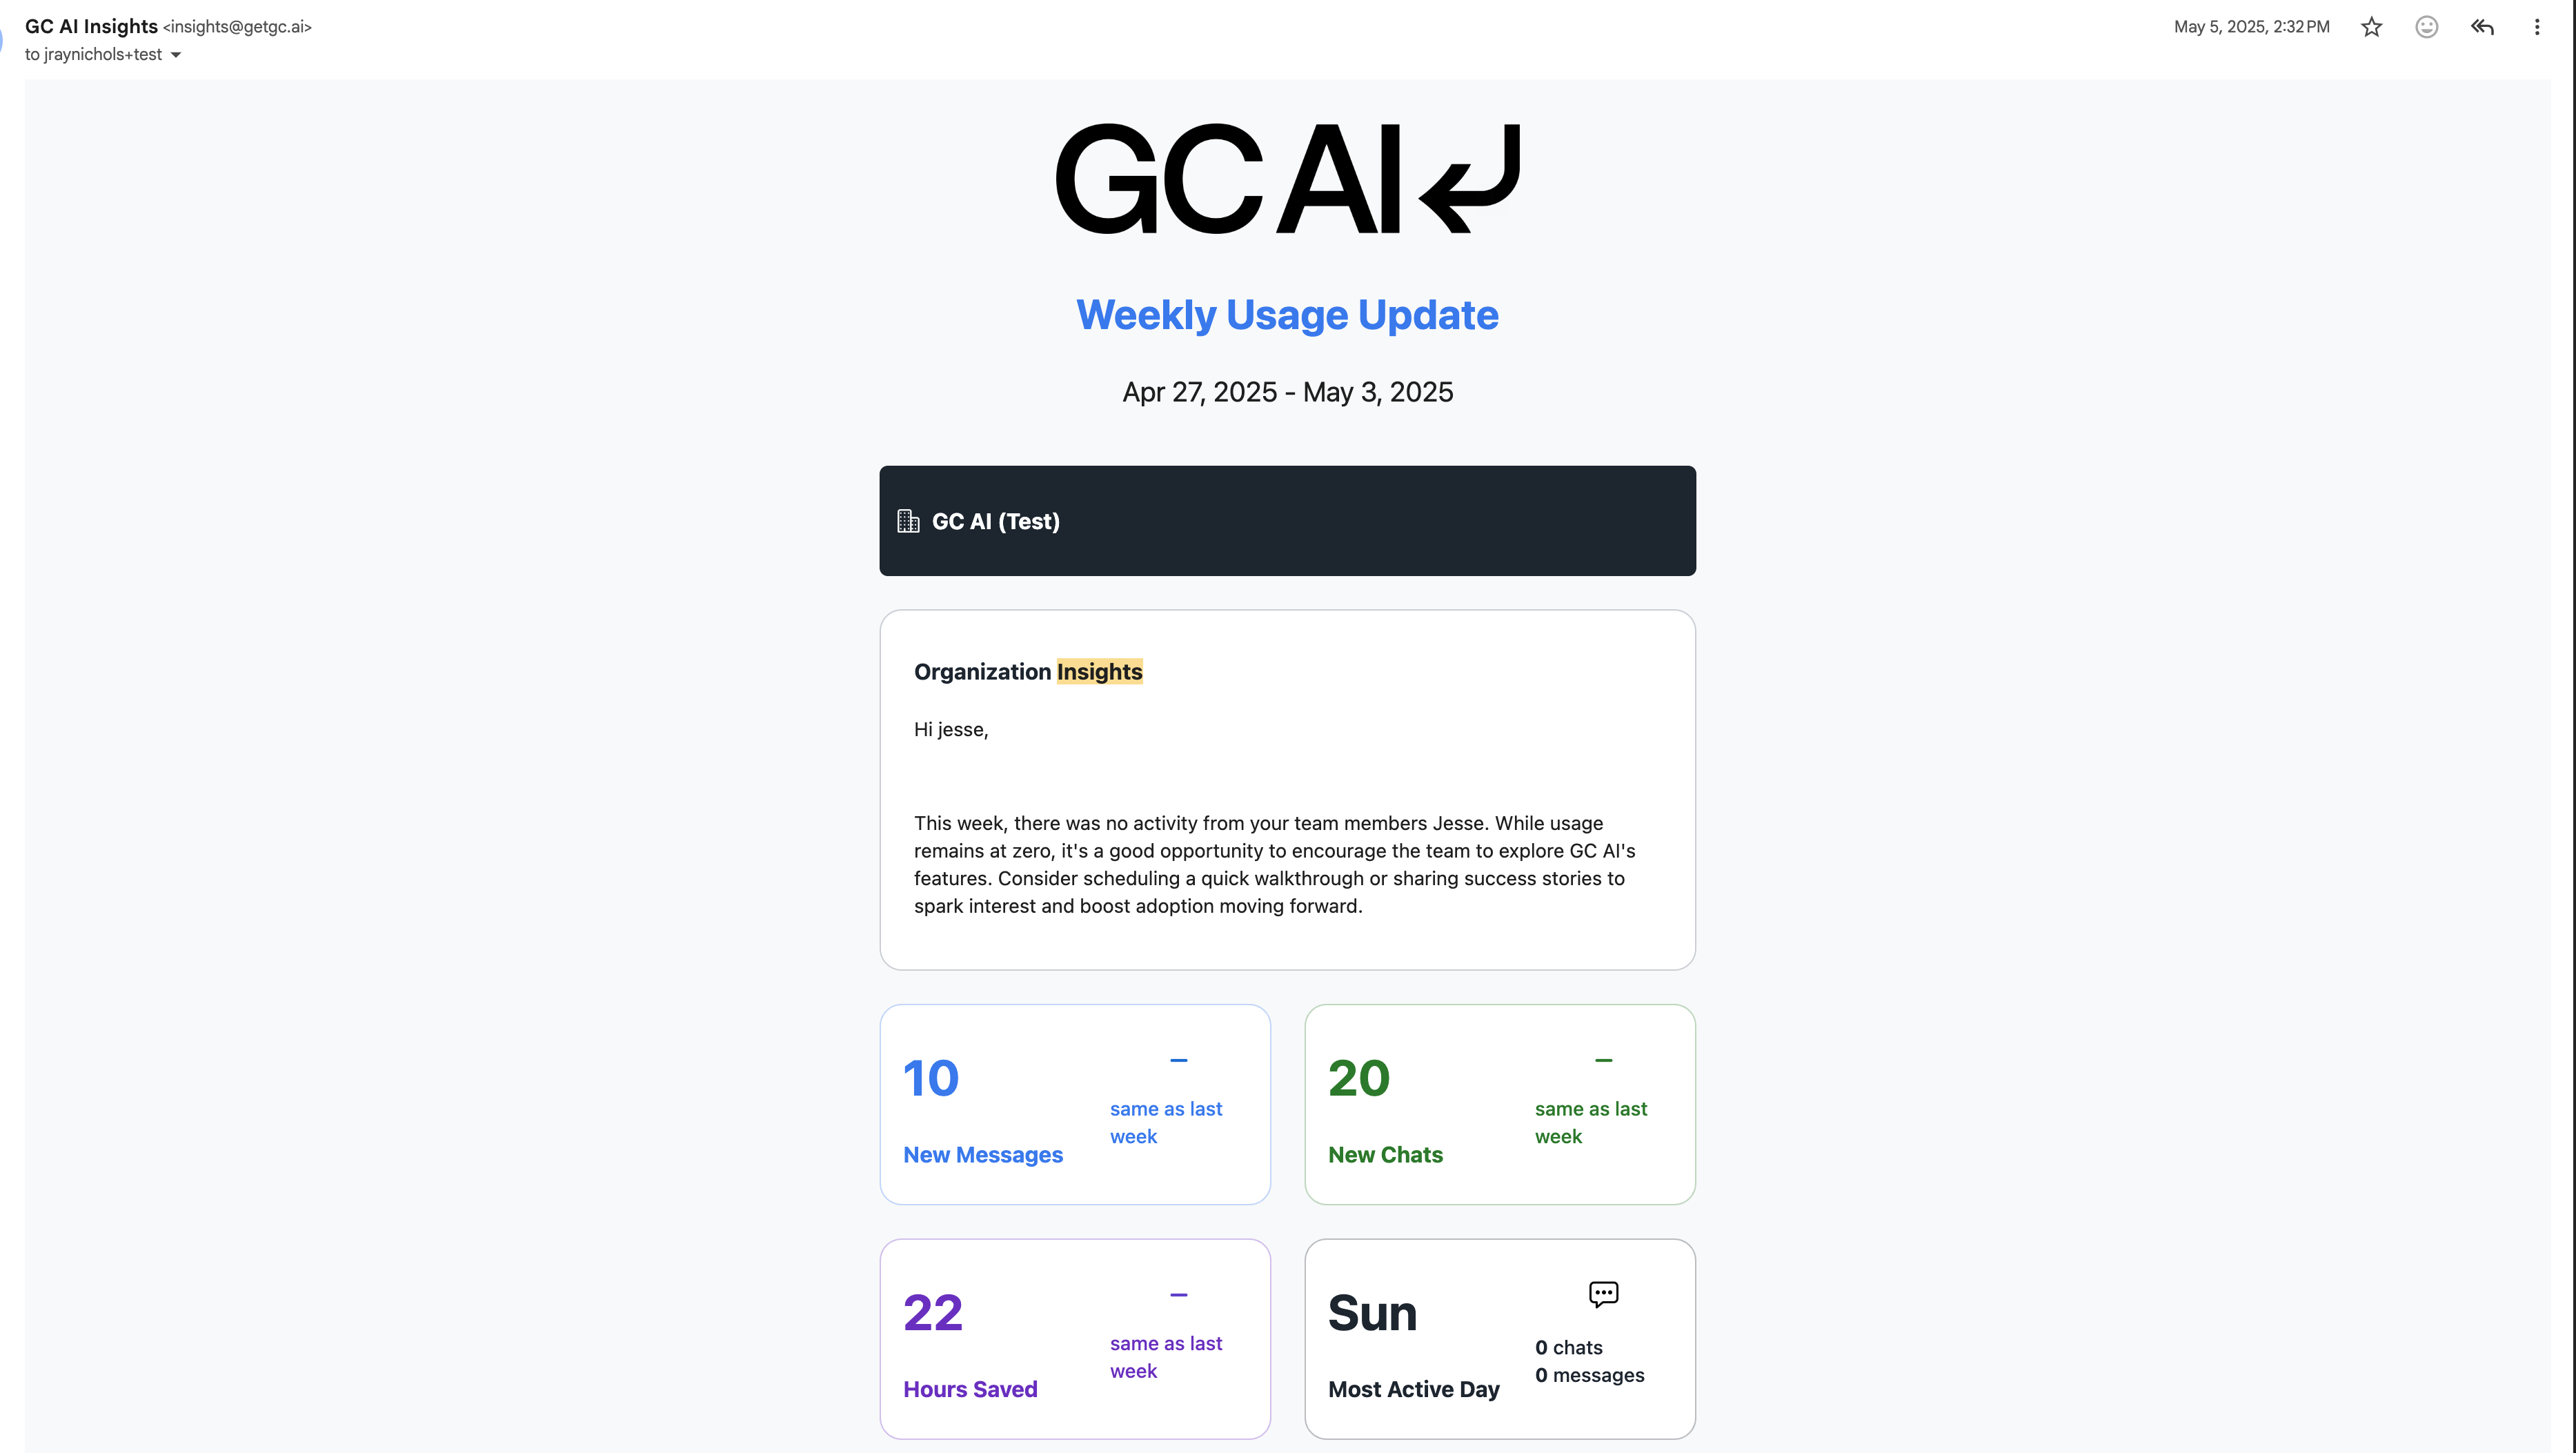
Every Monday, GC AI automatically sends comprehensive insights emails to help you stay informed about your organization’s usage:- Admin Insights Email: Sent to all admin users with organization-wide metrics and trends
- Personal Insights Email: Sent to individual users with their personal usage summary
- AI-Generated Insights: Each email includes personalized analysis and recommendations
📊 What’s Included in Admin Emails
The weekly admin insights email contains:- Organization Overview: Summary of the past week’s activity
- Key Metrics: Messages, chats, hours saved, and file analysis
- Trend Analysis: Week-over-week changes and improvements
- Most Active Day: Peak usage patterns and timing
- Member Rankings: Top users by messages and chats with rank changes
- Activity Metrics: Files analyzed, words read, and sites scanned
- Latest Resources: Newsletter updates and AI prompting classes
📈 What’s Included in Personal Emails
Individual users receive personalized insights including:- Personal Summary: AI-generated insights about their usage patterns
- Performance Metrics: Messages, chats, and percentile rankings
-
Time Savings: Estimated hours saved through AI assistance. Time saved is calculated based on multiple factors:
- 5 minutes saved per web message, estimated reading time for uploaded files and websites.
- 3 minutes per Word redline.
- 5 minutes per Word draft.
- Activity Breakdown: Files analyzed, words read, and sites scanned
- Growth Tracking: Week-over-week progress and improvements
Data Export & Sharing
Export Options
Each chart panel supports multiple export formats:- PNG: High-quality images for presentations
- SVG: Scalable vector graphics
- JPG: Compressed image format
- CSV: Raw data for spreadsheet analysis
- XLSX: Excel-compatible format with formatting
Export Features
- Chart-specific Data: Export only the data shown in each panel
- Member-filtered Exports: Include only selected team members
- Time-period Filtering: Export data for specific date ranges
Advanced Features
🔍 Member Filtering
- Selective Analysis: Focus on specific team members
- Role-based Views: Analyze usage by team roles
- Performance Tracking: Monitor individual productivity
📊 Column Layout
- Responsive Design: 1-column (mobile) or 2-column (desktop) layouts
- Customizable Views: Adjust layout based on screen size
- Optimized Display: Best viewing experience for different devices
🔄 Real-time Updates
- Live Data: Metrics update automatically
- Refresh Controls: Manual refresh when needed
- Data Currency: Information is current within a few hours
Best Practices
📈 Regular Monitoring
- Weekly Reviews: Check usage patterns and trends
- Monthly Analysis: Identify optimization opportunities
- Quarterly Planning: Plan resource allocation and training
🎯 Performance Optimization
- Usage Patterns: Identify peak usage times
- Feature Adoption: Track which capabilities are most used
- Training Needs: Spot opportunities for team education
📚 Additional Resources
🔗 Related Features
The metrics page is continuously updated with new features and improvements. Check back regularly for enhanced analytics capabilities.